Personal Cloud on Hetzner
After getting somewhere close to MVP with Awesome Job Descriptions web app,
I’ve deployed it to Vercel and quickly realized that waiting for OpenAI’s Assistant does not fit within 10 seconds timeout for their Hobby plan.
Plus I saw that Vercel’s healthcheck triggered /list route which is fetching table from Postgres, what is counting towards database compute hours.
I believe there is some smartness in figuring out which route to “healthcheck” :)
The Server
That made me thinking about alternative architect for the project – I deliberately chose simple and bold way of getting thing done and I do not want to complicate things initially. But everything looked to be asking for more services which will have their personal hobby plans which I will be struggling to fit int… That’s why I’ve decided to go for “my personal cloud”. I was with Hetzner 10 years ago, and decided to chekc it again. Last Friday, I checked server auction, where there were 1261 severs:
% jq  <./servers.json  '.server[]|.id' | wc -l
    1261
After consulting with ChatGPT on my plans, I’ve ended up with this one:
CPU1: Intel(R) Xeon(R) CPU E3-1275 v5 @ 3.60GHz (Cores 8)
Memory:  64108 MB
Disk /dev/nvme0n1: 512 GB
Disk /dev/nvme1n1: 512 GB
Plus static IP, all for 30,70 per month.
The OS
Server was delivered in rescue boot where it was pretty simple to install Ubuntu LTS (22.04) and setup software RAID 1. In a couple of minutes I’ve had Ubuntu server running with all but 22/tcp denied on public interface (thanks, UFW). Next step was to go with k8s.
The k8s
I don’t want to neither maintain nor clean different dependencies for my projects, would that be Node.js, Python, Rust or whatever I end up playing with. That
means I will invest some time in installing Kubernetes, so I can easily helm install things in containers and helm delete them after I don’t need them
anymore.
The implementation choice was made fast: I’ve installed microk8s via snap. Picking up some ports to allow with UFW – that took some time to read the Internet and logs, but here is what I ended up with:
$ sudo ufw status verbose
Status: active
Logging: on (low)
Default: deny (incoming), allow (outgoing), allow (routed)
New profiles: skip

To                         Action      From
--                         ------      ----
22/tcp                     ALLOW IN    Anywhere
Anywhere on cni0           ALLOW IN    Anywhere
Anywhere on vxlan.calico   ALLOW IN    Anywhere
Anywhere on cni0           ALLOW IN    10.0.0.0/8
Anywhere on vxlan.calico   ALLOW IN    10.0.0.0/8
Anywhere on flannel.1      ALLOW IN    10.0.0.0/8
53                         ALLOW IN    10.244.0.0/16
6443                       ALLOW IN    10.244.0.0/16
16443/tcp                  ALLOW IN    10.1.0.0/16
80/tcp                     ALLOW IN    Anywhere
443/tcp                    ALLOW IN    Anywhere
Anywhere                   ALLOW IN    10.1.0.0/16
176.176.176.176 30779/tcp  ALLOW IN    82.82.82.82
16443                      ALLOW IN    82.82.82.82
22/tcp (v6)                ALLOW IN    Anywhere (v6)
80/tcp (v6)                ALLOW IN    Anywhere (v6)
443/tcp (v6)               ALLOW IN    Anywhere (v6)

Anywhere                   ALLOW OUT   Anywhere on cni0
Anywhere                   ALLOW OUT   Anywhere on vxlan.calico
Anywhere (v6)              ALLOW OUT   Anywhere (v6) on cni0
Anywhere (v6)              ALLOW OUT   Anywhere (v6) on vxlan.calico
Notes on firewall rules
- Some rules are not needed, I suspect two for
10.244.0.0/16are also not used, but I don’t want to test it ATM: I’ll have my web app deployed and will do the cleanup with a reference. - I allowed Kubernetes API port 16443 traffic from my home network IP instead of bringing VPN on the server, as connection already uses TLS
with a client secret, this way I can just use
kubectlfrom my home network. - Port 30779 is for Portainer, so I can access it also from home network without forwarding ports with
kubectl.
Basic ingress test
I need to expose web apps to the internet, right? That’s why I am adding ingress. With microk8s enable ingress, getting one based on NGiNX reverse-proxy
which should be just fine. And deploying simple Apache server, from this manifest:
apiVersion: apps/v1
kind: Deployment
metadata:
  name: apache-deployment
spec:
  selector:
    matchLabels:
      app: apache
  replicas: 2 # ensures 2 instances are running for high availability
  template:
    metadata:
      labels:
        app: apache
    spec:
      containers:
        - name: apache-container
          image: httpd:2.4 # using the official Apache image
          ports:
            - containerPort: 80 # default Apache port
---
apiVersion: v1
kind: Service
metadata:
  name: apache-service
spec:
  selector:
    app: apache
  ports:
    - protocol: TCP
      port: 80 # the service port
      targetPort: 80 # the target port on the Apache containers
---
apiVersion: networking.k8s.io/v1
kind: Ingress
metadata:
  name: apache-ingress
spec:
  rules:
    - host: pumpking.aleksandr.vin
      http:
        paths:
          - path: /
            pathType: Prefix
            backend:
              service:
                name: apache-service
                port:
                  number: 80
After adding DNS A record to point sub-domain to my server’s IP, I’ve got the It works! page on port 80/tcp. Openning 80/tcp and later 443/tcp
I got a sick feeling in the pit of my stomach.
Then, following some consultations with ChatGPT and setting up cert-manager, I’ve finally got a Let’s Encrypt certifaicate issued for my sub-domain. These parts were initially added to apache’s ingress:
...
metadata:
  ...
  annotations:
    cert-manager.io/cluster-issuer: "letsencrypt-staging"
spec:
  tls:
  - hosts:
      - pumpking.aleksandr.vin
    secretName: pumpking-aleksandr-vin-tls  # cert-manager will store the created certificate in this secret
  ...
The letsencrypt-staging issuer should be replaced with letsencrypt-prod when you see that certificate is issued, otherwise
you can hit strict request limits while debigging the flow.
Then it took some time debugging, as apache’s ingress - path: / appeared to be shadowing the cert-manager’s ingress:
...
10.1.34.118 - - [10/Feb/2024:00:54:58 +0000] "GET /.well-known/acme-challenge/K3Da9oyctBaRvdxVECXDFphLxNvUEJWVZbmGxZQDmDs HTTP/1.1" 308 164 "-" "cert-manager-challenges/v1.8.0 (linux/amd64) cert-manager/e466a521bc5455def8c224599c6edcd37e86410c" 272 0.000 [default-apache-service-80] [] - - - - b600d4765792591b9d6f860cf2e9aa18
10.1.34.118 - - [10/Feb/2024:00:54:58 +0000] "GET /.well-known/acme-challenge/K3Da9oyctBaRvdxVECXDFphLxNvUEJWVZbmGxZQDmDs HTTP/1.1" 404 196 "http://pumpking.aleksandr.vin/.well-known/acme-challenge/K3Da9oyctBaRvdxVECXDFphLxNvUEJWVZbmGxZQDmDs" "cert-manager-challenges/v1.8.0 (linux/amd64) cert-manager/e466a521bc5455def8c224599c6edcd37e86410c" 383 0.001 [default-apache-service-80] [] 10.1.34.115:80 196 0.002 404 ff682040e089c201ca6434a755dc5257
...
$ microk8s kubectl get ingress -n default
NAME                        CLASS    HOSTS                    ADDRESS     PORTS     AGE
apache-ingress              public   pumpking.aleksandr.vin   127.0.0.1   80, 443   41m
cm-acme-http-solver-7xmfx   <none>   pumpking.aleksandr.vin               80        5m9s
And this workaround was found for apache’s ingress:
rules:
  - host: pumpking.aleksandr.vin
    http:
      paths:
        - path: /.well-known/acme-challenge/
          pathType: Prefix
          backend:
            service:
              # Use the solver service created by cert-manager. You need to find the correct name.
              # It should follow the pattern 'cm-acme-http-solver-xxxx'.
              name: cm-acme-http-solver-xxxx # Replace 'xxxx' with the actual solver service suffix.
              port:
                number: 80
        - path: /
          pathType: Prefix
          backend:
            service:
              name: apache-service
              port:
                number: 80
That ended up with a certificate in k8s secrets.
% kubectl get secret -o wide
NAME                                                              TYPE                 DATA   AGE
pumpking-aleksandr-vin-tls                                        kubernetes.io/tls    2      3d8h
...
UPDATE
I’ve found that this nginx ingress annotation will do the trick:
acme.cert-manager.io/http01-edit-in-place: "true"
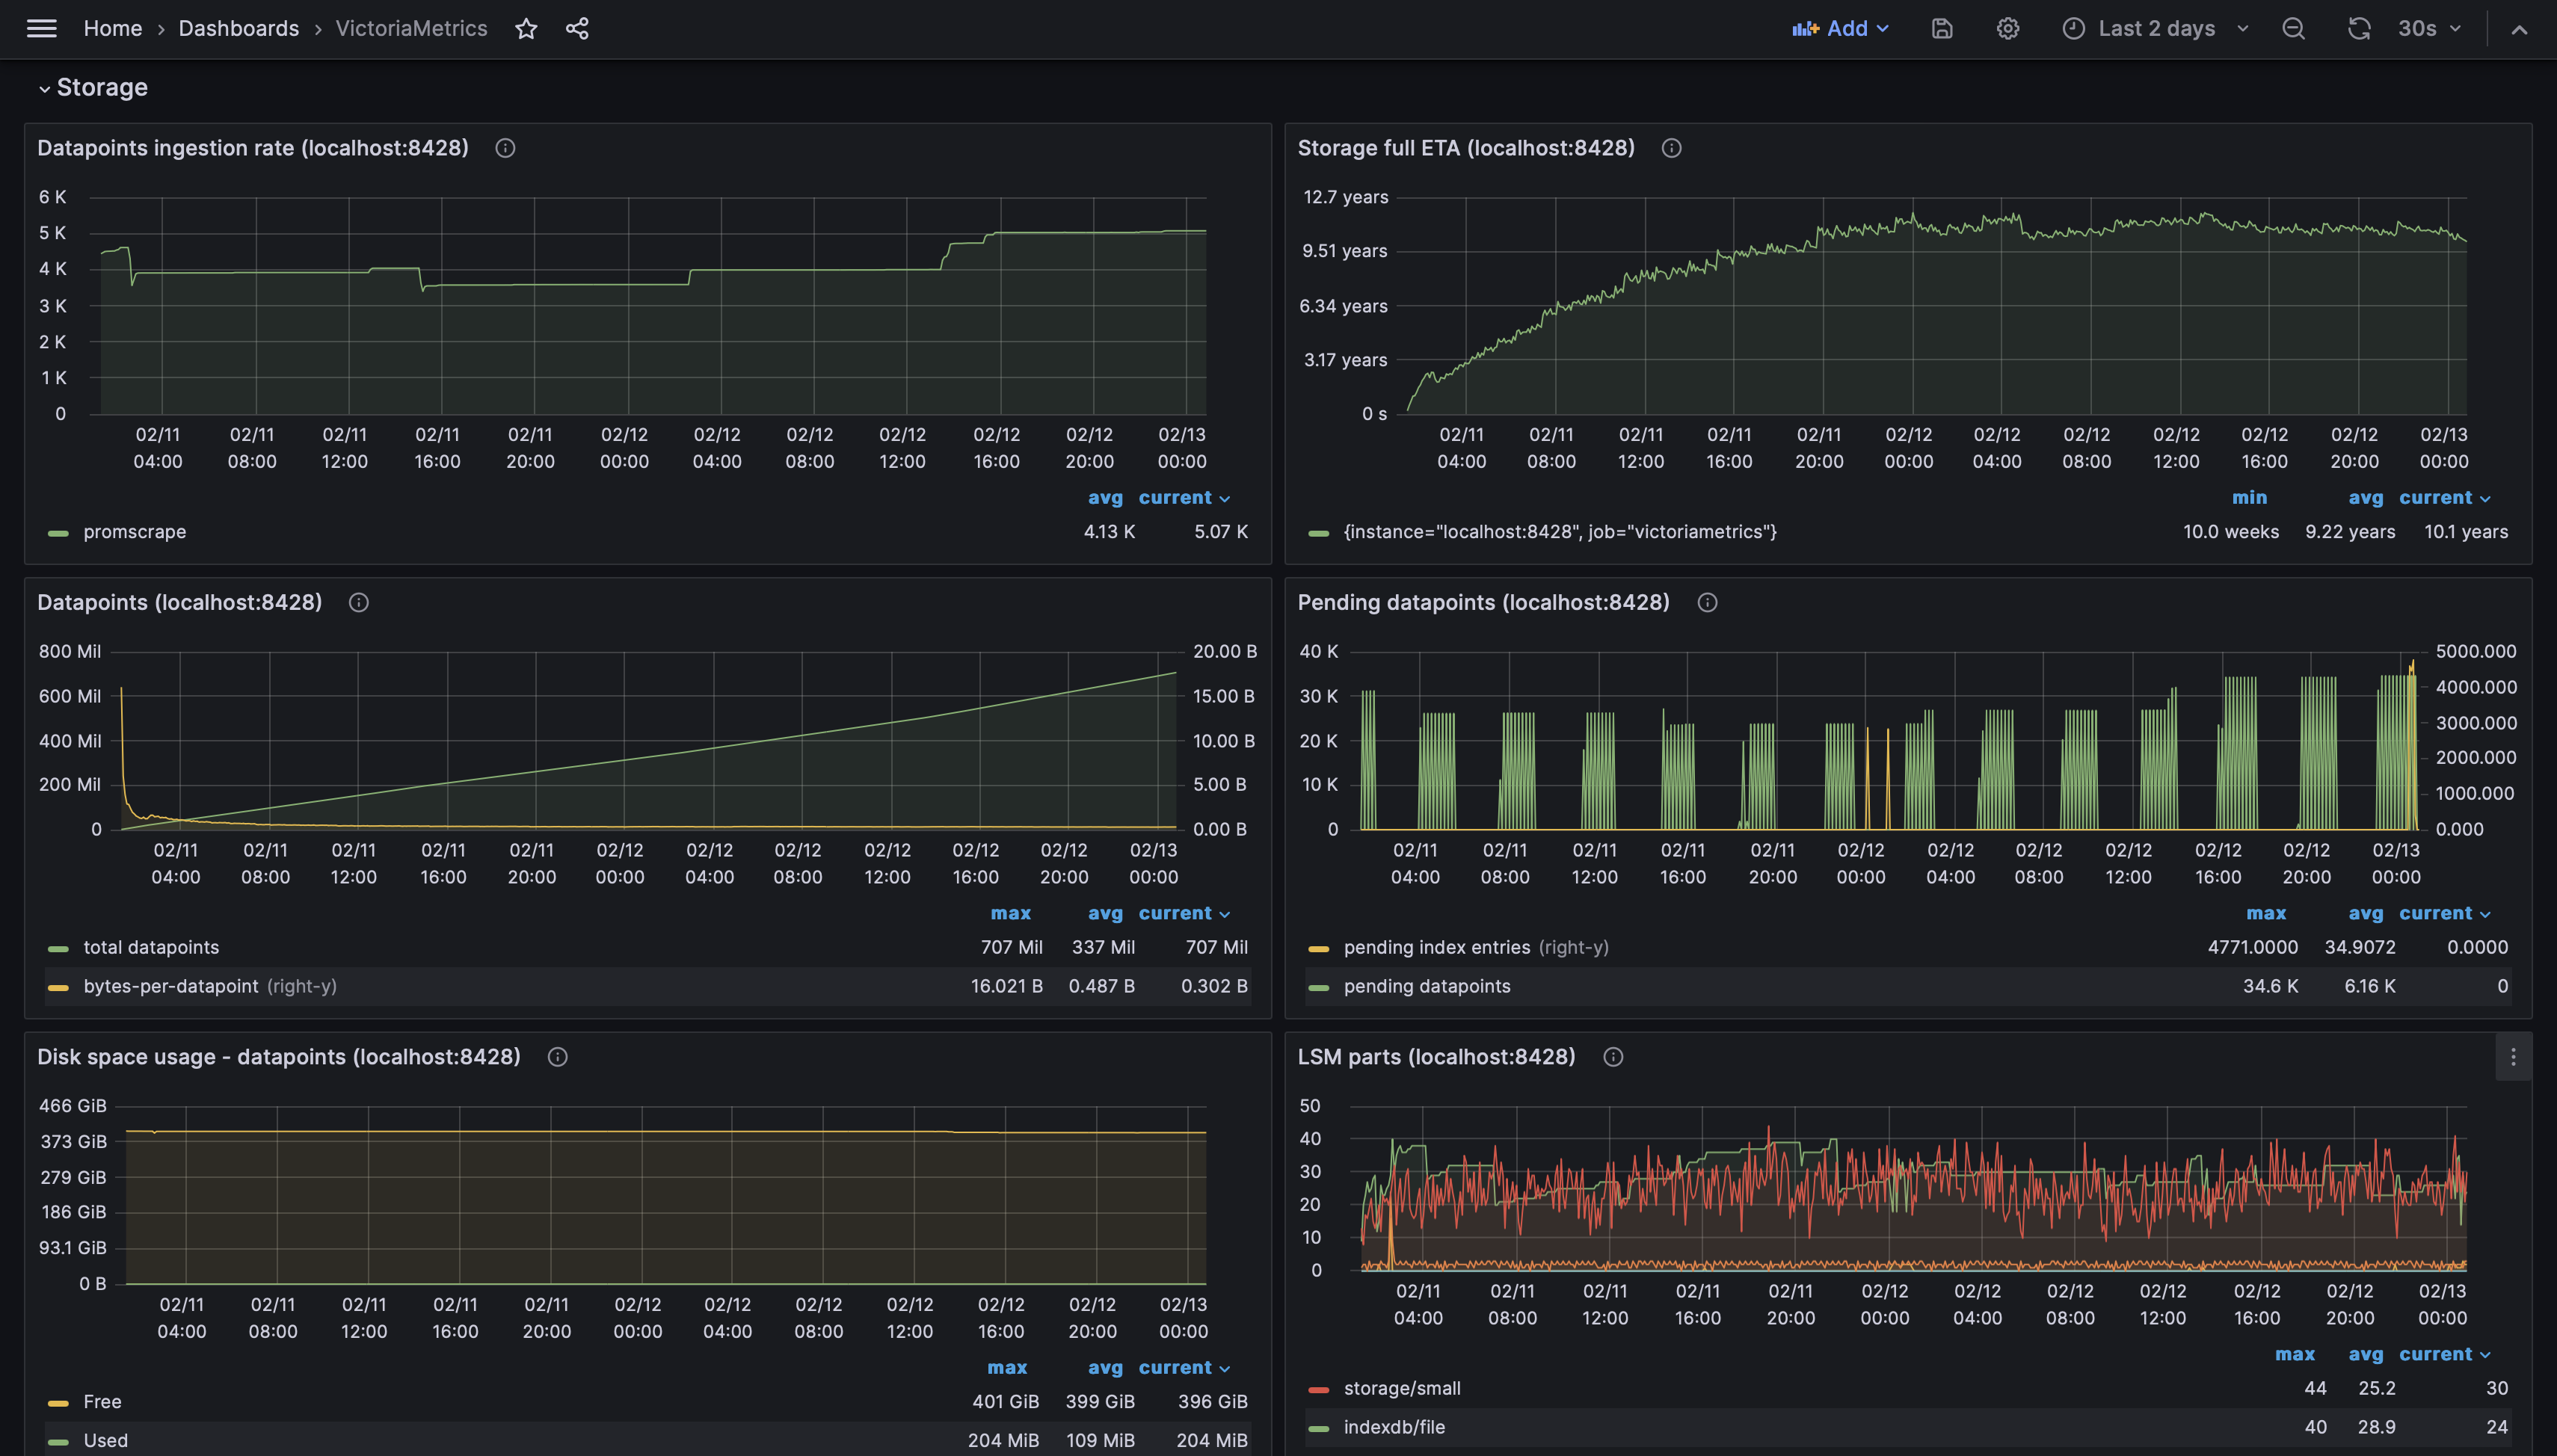
Metrics and Logs
On 7th of Feb, @oliora mentioned Victoria Metrics in twitter – I had no previous experience
with them but with Prometheus and Grafana, so I decided that it could be a nice time to try it. Installed victoria-metrics-single and grafana
helm charts plus victoria-logs-single: now all k8s metrics are collected in vm and logs in vl. The Victoria Logs are not yet very mature, comparing
to Elastic features, but it looks promising and could be worth to follow.
To access Grafana and Victoria Logs, I do port forwarding with kubectl to their respected pods, having these shell functions is good enough for me:
pf-grafana() {
  POD_NAME=$(kubectl get pods --namespace default -l "app.kubernetes.io/name=grafana,app.kubernetes.io/instance=my-grafana" -o jsonpath="{.items[0].metadata.name}")

  cat <<EOF

  Grafana should be on http://localhost:3000

EOF

  kubectl --namespace default port-forward $POD_NAME 3000
}


pf-victorialogs() {
  POD_NAME=$(kubectl get pods --namespace default -l "app=server,app.kubernetes.io/name=victoria-logs-single" -o jsonpath="{.items[0].metadata.name}")

  cat <<EOF

  Victoria Logs should be on http://localhost:9428

EOF

  kubectl --namespace default port-forward $POD_NAME 9428
}
Now I can read ingress “newsletter”:
% while true ; do curl http://localhost:9428/select/logsql/query -d 'query=_stream:{kubernetes_container_name="nginx-ingress-microk8s"} _time:1m' ; sleep 60 ; done
{"_msg":"158.69.7.211 - - [12/Feb/2024:21:34:49 +0000] \"GET /w00tw00t.at.ISC.SANS.DFind:) HTTP/1.1\" 400 150 \"-\" \"-\" 46 0.000 [] [] - - - - d70a41c0e6029b3cc0f6a8509df08428","_stream":"{kubernetes_container_name=\"nginx-ingress-microk8s\",kubernetes_pod_name=\"nginx-ingress-microk8s-controller-4zr2m\",stream=\"stdout\"}","_time":"2024-02-12T21:34:49.30909Z"}
{"_msg":"164.52.0.94 - - [12/Feb/2024:21:41:16 +0000] \"\\x16\\x03\\x01\\x02\\x00\\x01\\x00\\x01\\xFC\\x03\\x03\" 400 150 \"-\" \"-\" 0 0.231 [] [] - - - - 006e01f1d44b098dde44bc9d8d42fbae","_stream":"{kubernetes_container_name=\"nginx-ingress-microk8s\",kubernetes_pod_name=\"nginx-ingress-microk8s-controller-4zr2m\",stream=\"stdout\"}","_time":"2024-02-12T21:41:16.913674Z"}
{"_msg":"164.52.0.94 - - [12/Feb/2024:21:41:52 +0000] \"\\x16\\x03\\x01\\x02\\x00\\x01\\x00\\x01\\xFC\\x03\\x03/\\xE9ep\\x0B\\xC4\\xD7\\x95_\\x1F\\xD9\\x0F\\xE1L\\x07\\x84!\\xCB\\x09\\xEC\\xB1\\xAA\\xB0\\x08\\xEEA\\x95\\x84\\x96\\xDCm\\xD1 H\\xE3[mmU\\xF3O\\x8A\\xB9\\x1AD\\x97\\xB1\" 400 150 \"-\" \"-\" 0 0.233 [] [] - - - - 5b3ac70efd5f1f290911296c928f1123","_stream":"{kubernetes_container_name=\"nginx-ingress-microk8s\",kubernetes_pod_name=\"nginx-ingress-microk8s-controller-4zr2m\",stream=\"stdout\"}","_time":"2024-02-12T21:41:52.472255Z"}
{"_msg":"143.198.214.253 - - [12/Feb/2024:22:28:08 +0000] \"\\x16\\x03\\x01\\x01\\x04\\x01\\x00\\x01\\x00\\x03\\x03\\x99}+\\xFA\\xFDN\\xFE\\x16Bw\\x8D\\xBB\\xE6\\xFE\\xF5\\xE6E~\\xB2\\x83/lf\\xC5\\xAC|\\xE8\\xC9\\x9B\\xD2\\x1D^ u\\xC0~\\xDA\\xB6\\x80\\x7F\\x81e\\xC1\\xBE\u003c\\xD4W\\xC3\\xFCo\\xBA\\xBB2\\x17x\\xE2Y0\\xAE\\x8Cy~\\xC5\\x16\\xF1\\x00&\\xC0+\\xC0/\\xC0,\\xC00\\xCC\\xA9\\xCC\\xA8\\xC0\\x09\\xC0\\x13\\xC0\" 400 150 \"-\" \"-\" 0 0.170 [] [] - - - - 9e74286fe7d9fba47af575eba27da895","_stream":"{kubernetes_container_name=\"nginx-ingress-microk8s\",kubernetes_pod_name=\"nginx-ingress-microk8s-controller-4zr2m\",stream=\"stdout\"}","_time":"2024-02-12T22:28:08.470892Z"}
And see metrics collected:
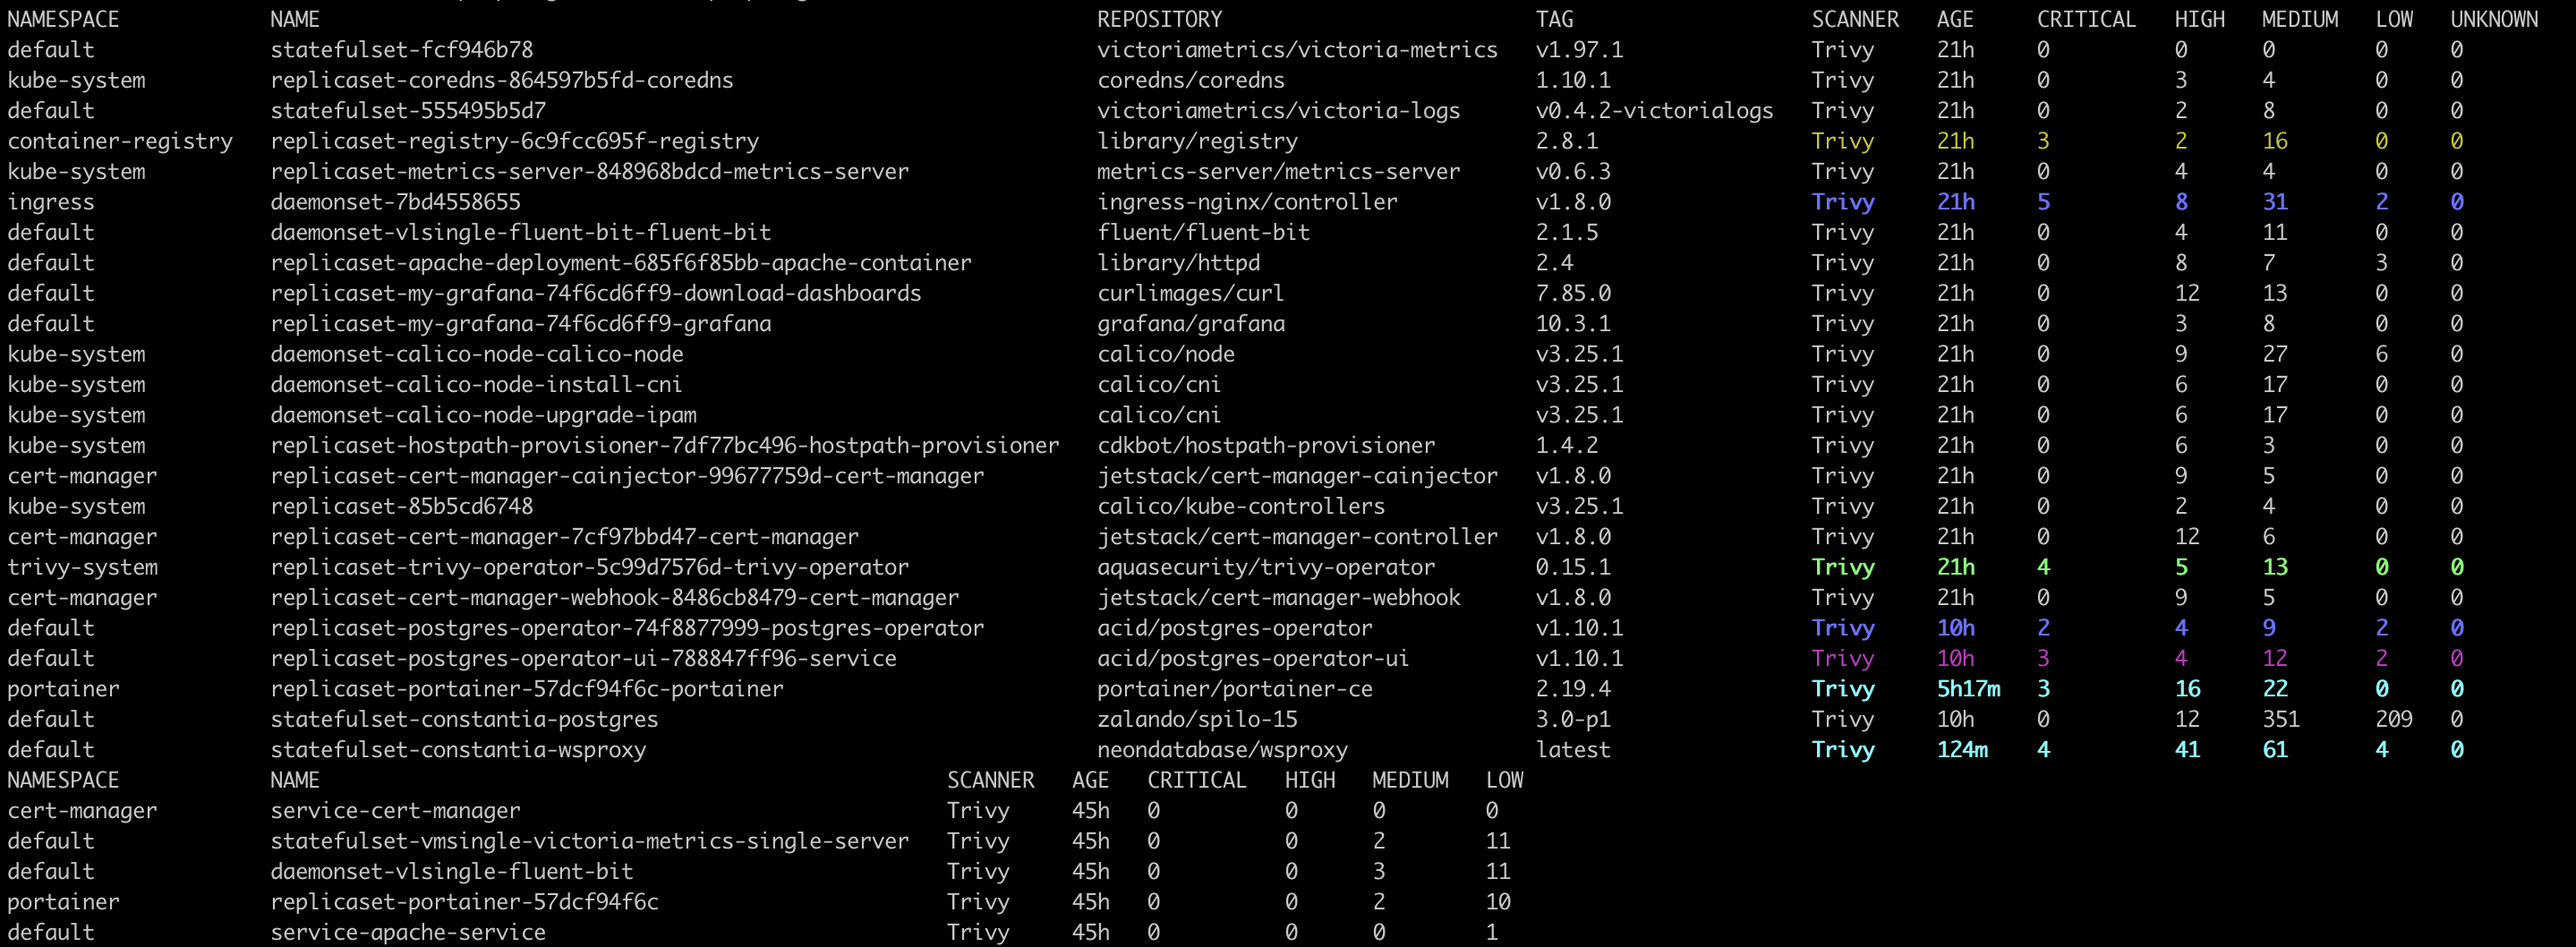
Security
Okay, k8s is getting more and more containers, how about some security. Trivy is a known pal for me, was setting it up some years ago in build
pipelines. Added microk8s enable trivy to bring kubernetes operators for vulnerability and configuration scans.
Very handy: it runs regular scans for configmaps and containers and create reports, which you can list and describe later.
I list and highlight reports every time I activate KUBECONFIG in my terminal:
kubectl get vulnerabilityreports --all-namespaces -o wide | colorize '\sTrivy\s+.+\s+[1-9][0-9]*\s+[0-9]+\s+[0-9]+\s+[0-9]+\s+[0-9]+'

kubectl get configauditreports --all-namespaces -o wide | colorize '\sTrivy\s+.+\s+[1-9][0-9]*\s+[0-9]+\s+[0-9]+\s+[0-9]+'
Database
It was tempting to bring in Supabase – that thing could be worth setting up for “my personal cloud”. But after doing some research on the internet, I did not find living helm charts. For example, official ones github.com/supabase-community/supabase-kubernetes are 1 year old. And I don’t spare much time to spend on building one myself.
That’s why I’ve opted for Postgres operator, which makes it easy to deploy and manage Postgres clusters on k8s. Devs in Zalando made a good job and documented it well: quickstart is very easy to follow. Plus you’ll get Postgres Operator UI to maange your pg clusters.
One thing could be missing is pgAdmin, which is not so hard to install separately:
helm install my-pgadmin runix/pgadmin4 -f pgadmin4-values.yaml
Then creating a Postgres cluster is a matter
of creating a postgres resource with:
kubectl create -f manifests/minimal-postgres-manifest.yaml
From a manifest like this:
kind: "postgresql"
apiVersion: "acid.zalan.do/v1"

metadata:
  name: "constantia"
  namespace: "default"
  labels:
    team: acid

spec:
  teamId: "acid"
  postgresql:
    version: "15"
  numberOfInstances: 1
  volume:
    size: "10Gi"
  users:
    awesome_jd_user: []
  databases:
    awesome_jd: awesome_jd_user
  allowedSourceRanges:
    # IP ranges to access your cluster go here
    - 10.1.0.0/16

  resources:
    requests:
      cpu: 100m
      memory: 100Mi
    limits:
      cpu: 500m
      memory: 500Mi
I’ve added 10.1.0.0/16 IP range to allow connections from pgAdmin. Follow this
section
to get password, and do kubectl port-forward constantia-0 5432, where constantia-0 would be pod name for main
DB instance.
Adding these two bash functions to dev tools:
pf-postgres-operator-ui() {
  cat <<EOF

  Postgres operator UI should be on http://localhost:8081

EOF

  kubectl port-forward svc/postgres-operator-ui 8081:80
}

pf-pgadmin() {
  POD_NAME=$(kubectl get pods --namespace default -l "app.kubernetes.io/name=pgadmin4,app.kubernetes.io/instance=my-pgadmin" -o jsonpath="{.items[0].metadata.name}")

  cat <<EOF

  pgAdmin4 should be on http://localhost:8080

EOF

  kubectl port-forward $POD_NAME 8080:80
}
Sidecars
So far so good, but NEXT.js app is using @vercel/postgres to talk to database and Vercel Postgres is using a Neondatabase
websocket->TCP proxy to access PG.
This post
helps with getting NEXT.js app running with local Postgres. I could throw away @vercel/postgres but I decided to not to do that (now) but instead
configure a sidecar with this proxy.
Add to manifests/minimal-postgres-manifest.yaml:
sidecars:
  - name: wsproxy
    image: ghcr.io/neondatabase/wsproxy:latest
    env:
      - name: APPEND_PORT
        value: "localhost:5432"
      - name: ALLOW_ADDR_REGEX
        value: ".*"
      - name: LOG_TRAFFIC
        value: "true"
    ports:
      - name: wsproxy-port
        containerPort: 80
    resources:
      requests:
        cpu: 50m
        memory: 50Mi
      limits:
        cpu: 100m
        memory: 100Mi
Then recreate the db cluster and forward port to it with:
kubectl port-forward constantia-0 5433:80
The Web App
TBC.